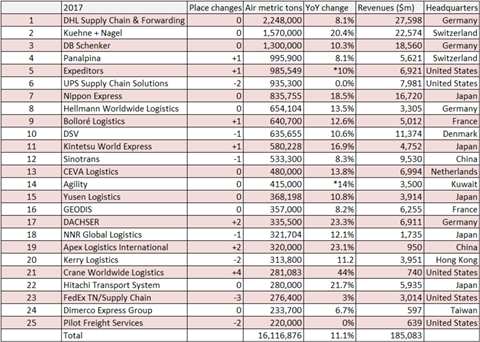
DHL Global Forwarding remained the world’s largest airfreight forwarder in 2017, (see chart below) but second placed Kuhne+Nagel continued to close the gap and the rest of the major players enjoyed a bumper year.
As expected, the latest annual figures from analyst Armstrong & Associates show that the world’s top airfreight forwarders saw rapid growth in 2017, with total tonnage across the leading 25 increasing by 11.1% to 16.1m metric tonnes.
This was above market growth of around 9%, a reflection of acquisitions and investments made by the top players.
At the top of the pile was once again DHL Global Forwarding as it saw air cargo demand during the year increase by 8.1% to 2.3m metric tons - roughly in line with the market.
However, its rival European forwarder Kuehne+Nagel grew at twice the market rate with a 20.4% jump in airfreight volumes to 1.6m metric tons.
Performance was boosted by the acquisition of Commodity Forwarders in the US and Trillvane in Kenya, both perishables specialists, while it said industry-specific airfreight solutions, for example for the pharma and healthcare or the aerospace sectors, generated significant growth.
Once again taking the third spot was another Germany based forwarder, DB Schenker, which registered a 10.3% increase in airfreight demand to 1.3m metric tons.
This was slightly above market growth levels and attributed by the forwarder to growth in automobile and consumer goods in Asia and Europe, while its strongest growth was on the trade route between Asia and the US.
Fourth and fifth placed Panalpina and Expeditors, both up one place from last year, also enjoyed a strong year with demand up roughly in line with the market at 8.1% and 10% compared with a year earlier.
Elsewhere, the fastest growing freight forwarder was Crane Worldwide Logistics, which registered a 44% increase in demand to 281,083 metric tons.
The forwarder has not mentioned any special reasons for the demand increase but it has been targeting the European airfreight market of late with new offices/facilities opened at London Heathrow and Amsterdam airport. It is clearly easier for a smaller forwarder to grow above the market than a larger player.
It also re-organised its European team at the start of last year and launched a new customer portal.
The increase saw the forwarder leap four places up the table to 21st position.
One other trend in this year’s figures is that no forwarder registered a decrease in volumes, although demand was flat at UPS and Pilot Freight Services.
UPS will not reveal its airfreight tonnage figures, while Air Cargo News has asked for an update from Pilot.
Excluding these two firms, FedEx Trade Networks and Supply Chain registered the smallest increase, just 3%, to 276,400 metric tons. This resulted in the company dropping three places down the list to 23rd place.
While volumes grew rapidly last year, revenues tended to lag slightly behind. Armstrong & Associates converts all reported figures into US dollars in order to compare the size of different companies.
This makes year-on-year company comparisons based on the Armstrong & Associates revenue figures difficult as they are affected by the changing exchange rates.
however, a quick glance at the leading six airfreight forwarders' revenue growth as reported in their annual reports shows that takings tended to grow at a slower rate than volumes.
For instance, DHL saw revenues increase by 5.4% year on year, there was an 11.2% increase at Kuehne + Nagel and DB Schenker increased by 8.6%.
There often tends to be a bit of market lag with forwarders struggling to instantly pass through price increases from carriers through to their customers.

- Revenues and metric tons are company reported or Armstrong & Associates, Inc. estimates. Revenues have been converted to US$ using the average annual exchange rate in order to make non-currency related growth comparisons. Copyright © 2018 Armstrong & Associates, Inc.
Year-on-year volume growth rates calculated by Air Cargo News based on 2016 and 2017 Armstrong & Associates figures. * = restated based on company reports.
Click here for the 2016 report
Click here to see the 2015 list.
Click here to see the 2014 list.


