Global: Hong Kong still top of the hubs
Hong Kong looks set to remain the top air cargo airport for 2015 despite a near static performance with only a 0.1% rise in freight volumes to 4.4m tonnes. US integrator hub Memphis, number two in 2014, has still to report its full-year results.
Memphis, home to parcels giant FedEx, showed an average 1.2% rise in the first nine months of 2015 which, if it kept at that level, would again place the US mega-hub behind its Asian rival.
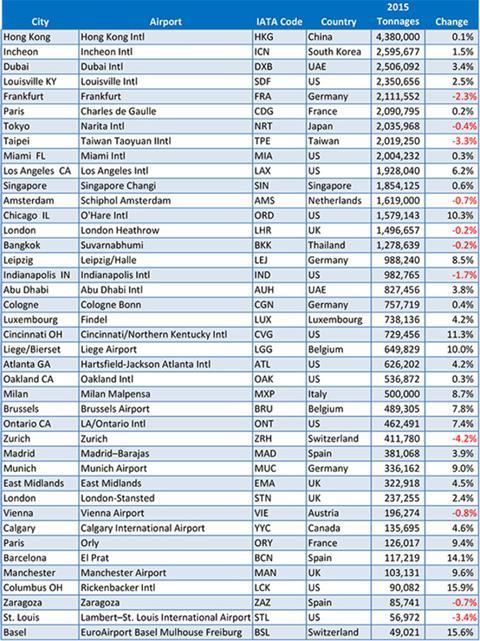
Air Cargo News has collated a basket of 40 global airports which have reported that 2015 cargo tonnages to provide an indicative early screenshot of the industry’s cargo gateway performance for the year just passed.
A few caveats first. Many of the key mainland Chinese airports and a couple of the US big beasts, plus those in Latin America and Africa, have yet to issue their results for 2015. There is, however, a sufficient number of last year’s top 20 hubs that have published their 2015 throughputs – fourteen in all ─ to prove a valuable insight into global and regional variation.
If we focus on the representative basket of the top 20 freight hubs (below, figure 1), we see that seven airports recorded a decline, with Taiwan’s Taipei airport having the largest decrease, at 3.3% to just over 2m tonnes, with Europe’s top cargo hub, Frankfurt, the next highest with a 2.3% fall to 2.1m tonnes.
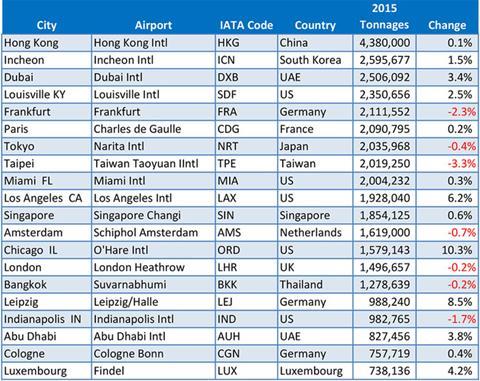
Figure 1.
Europe: Frankfurt down but not out
At a regional level, with most of the results in, we see (figure 2) that the top four have maintained their league positions from 2014: Frankfurt at the top, but closely followed by Paris CDG which recorded 0.2% rise in its throughputs.
Frankfurt blamed “weakening global trade and economic difficulties in some emerging markets”, while the fall in volumes for German flag carrier Lufthansa Cargo added to the woes.
There is then the traditional step down to third place, with Amsterdam Schiphol at 1.6m tonnes – down by 0.7% – due mainly to a 2.8% fall in its largest market, Asia, although the Netherlands hub saw better traffic levels in the second half of the year.
Next comes London Heathrow, still battling to secure a third runway, which dipped 0.2% to just under 1.5m tonnes, so well ahead of fifth placed Leipzig, whose DHL volumes saw it jump 8.5% in 2015 and so almost joining the hub millionaires’ cargo club.
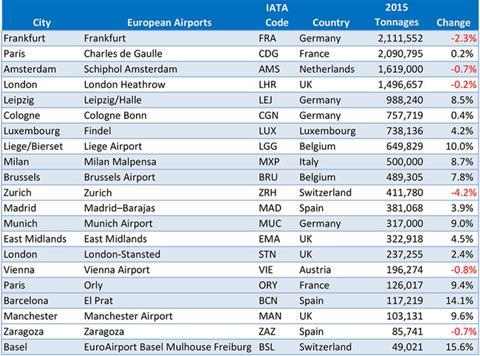
Figure 2
Asia: Hong Kong leads the pack
Global leader Hong Kong (Figure 3) saw static cargo growth in 2015, as dampening China traffic scaled back volume to the tiniest of percentage increases, at 0.1%, a far cry from the 6.1% registered in 2014 versus prior year.
Full-year statistics for Chinese airports have yet to emerge but those glimpses available for 2015 saw Shanghai’s major ground handler, Sino-German joint venture PACTL, record a healthy 6.5% surge to 1.6m tonnes as imports were sucked in by a rising demand for consumer goods.
And while questions remain about China’s GDP growth this year, it will still outpace most global economies as e-commerce takes hold.
There was a mixed bag for the other top Asian hubs, with South Korea’s Incheon up 1.5%, Tokyo down by 0.4% and Singapore with throughputs up by 0.6%.
Middle East: Dubai does it again
In the Middle East, based on a limited data set (Figure 3), Dubai (DXB) International recorded a 3.4% growth to 2.5m tonnes, although statistics for new UAE hub Al Maktoum International (DWC) are not yet available.
Abu Dhabi also saw an increase, although its 3.8% rise to 828,000 tonnes was from a lower base.
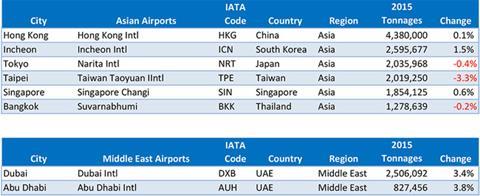
Figure 3
North America: Sitting on the dock of an air cargo bay
With full-year statistics for big players Memphis, Anchorage and New York still to come, it looks as if most air cargo hubs (Figure 4) in the US and Canada had a reasonable 2015, with many hubs registering an increase, although some of that was inflated by ‘windfall’ cargo flows from the west coast ports dispute early in the year.
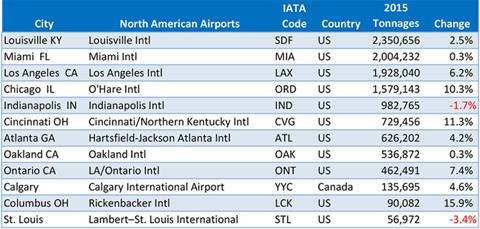
Figure 4
Top 40 cargo hubs, based on latest available full year 2015 results for reporting airports

If your airport has not been included in this listing, please send the 2014 and 2015 air cargo totals to the editor by clicking here. Please include your full contact details.

